Over the course of Congruence Engine, we have created a wealth of data from across the various strands of work. From annotated images to lists of organisations extracted from directories, the data available to the project kept increasing as we progressed. In the project’s final months, we started to bring these strands together to create a unifying model to capture the data and make it possible to query or browse it together as a whole.
The initial phase of this investigation was in analysis of the existing datasets, a meticulous piecing together of the disparate parts into a framework that could be used to weave all the data together. Models of real world entities were built up in stages. The entities’ attributes were examined and defined. Vocabularies to describe those attributes were then compiled using the data to guide the scope. Finally, the relationships between the entities emerging from the data were added to the model.
The model contains the entities of people, places, objects and organisations. Taking objects as examples, these are real world material objects that exist and can be examined. They include machines that are housed within the Bradford Industrial Museum, documents in the West Yorkshire Archives and even statues, such as the monument to Titus Salt in Saltaire.
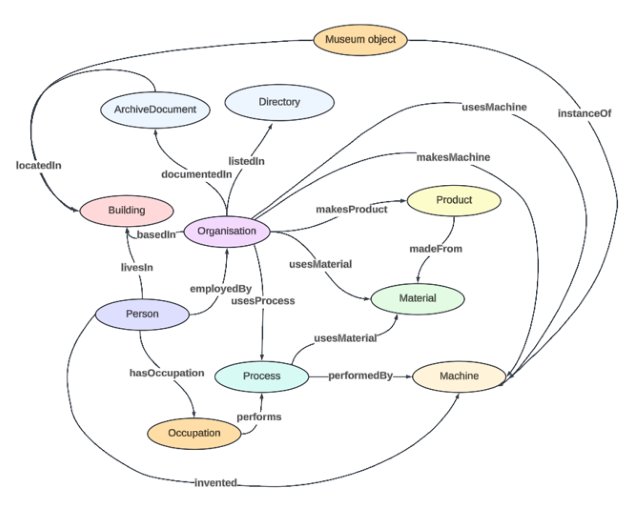
The attributes for these objects include the date they were created, a seemingly simple concept, except for the fact that often we don’t have an exact date for this and have to use a date range instead. Other attributes, such as the object type, required a vocabulary of types, such as machines or documents, with subcategories down to machine types such as combing machines and document types such as sales ledgers. There are links to other entities as well, such as the person or company that created the item, or the owner and user. Finally, there is the location of the item, which may be a museum or archive or public space.
The model, although complete, is still a work in progress. The vocabularies will change over time as new data are added and reveal additional dimensions that cannot be accommodated by the model. This is one of the reasons we have created it as a graph database: these are much more accepting of additions, whereas relational databases, although more efficient, are less flexible.
With these complex models, their vocabularies, and the interlinking between them now established, the data can be structured in a way that can be used to populate the models. This allows for continued experimentation on the data, with the intersection of all of the diverse data sets providing scope for asking a broader range of questions than was previously possible. Above all, the location data allows for geo-restricted queries that use a map area, rather than a location name, to filter the results.
We decided to create the database within Arches, which is an open source heritage software platform that makes it easy to share our data with others in the heritage sector and beyond. The vocabularies were loaded first, then the object models, and finally the data we had created; all could be brought together in one place.

As we have seen from earlier work on the project, geo-locating items can help tell the story of an organisation or industry over time. This broader model, now populated with data, could reveal further shifts in the textile industry, for example, over time, perhaps allowing us to map the areas of cotton against woollen textile production and how these shifted over time. Or it could show the rise and fall of the textile industry as a whole over centuries. It could also be used to give a snapshot of a particular industry at a certain time, such as the number of companies trading in wool waste at the turn of the twentieth century.
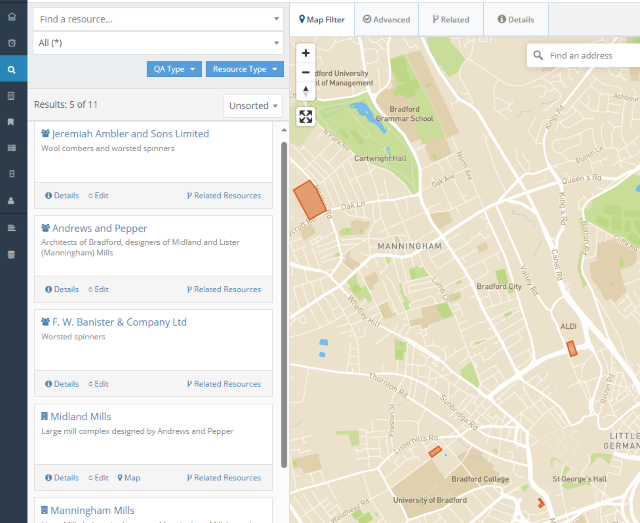
Once all of the entities have been added to Arches, it will also be possible for non-specialist users to browse using the map interface. Simply zooming in to a single street or area will recreate the layout of the mills and industries, the businesses and particularly the people who were the driving force behind the textile industry in industrial Bradford. This makes it possible to share our discoveries with descendants of the people who made it possible in the first place.