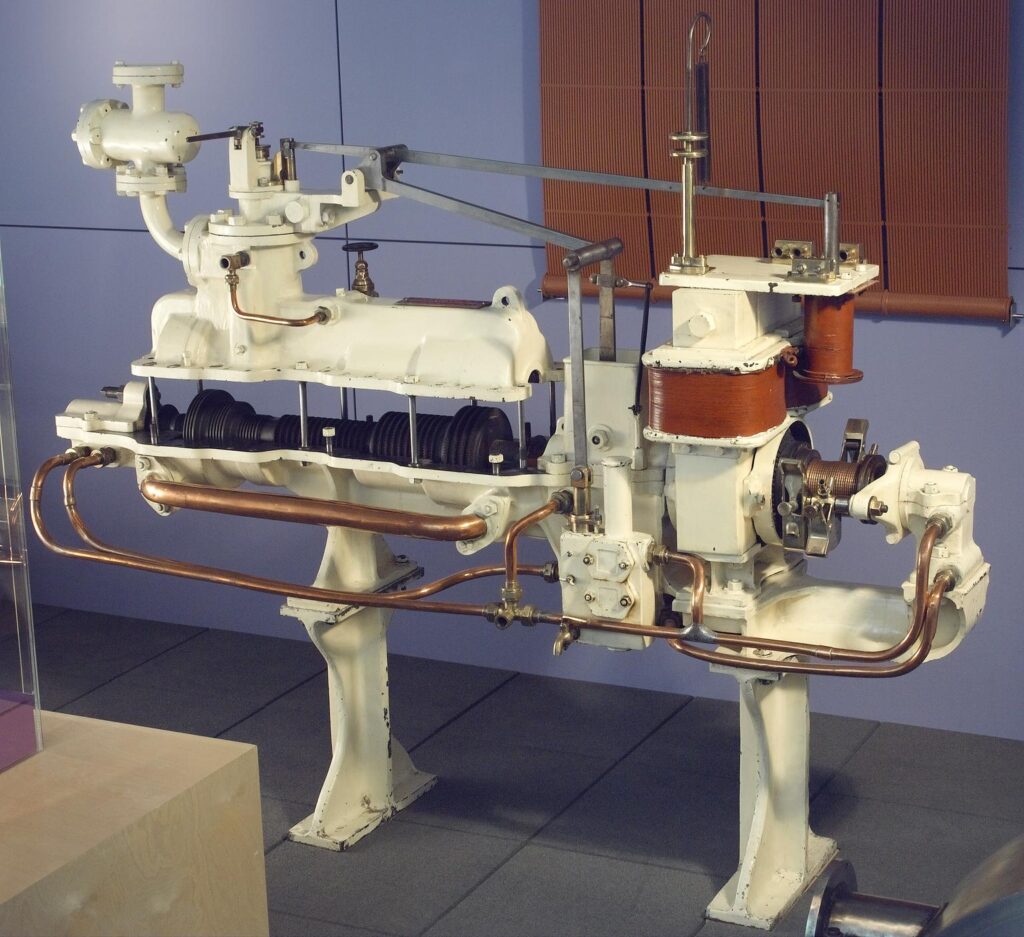
What can we learn from visualising museum objects on a map? For example, what new insights do we get from showing the places where Parsons turbines or turbo-alternators were installed? (Turbines are more efficient steam engines used for electricity generation, which use a special arrangement of blades to control the flow of gas and steam.) Charles Algernon Parsons was the inventor of the modern steam turbine. Although the turbines were manufactured within the Newcastle district, our project shows that this is not a local or regional story. Instead, turbines were ordered from across the British Empire, and fuelled its industry on a global scale.

Parsons steam turbines not only form part of a national story, but also part of a global and imperial history. While many orders came from the territories of the British empire, other locations included continental Europe, South and North America, and South-East Asia. Visualising these connections helps us ask new questions about international competition between turbine manufacturers and the reputation of Parsons turbines within this international market.

One advantage of the map that we are creating is the ability to demonstrate the take-up of Parsons turbines over time. It enables us to see which clients and regions invested early in the turbine, and which clients continued with regular orders. Such visualisations allow us to see the rhythms and waves of history play out in front of our eyes. A Parsons turbine no longer remains a large and seemingly immoveable object. In large numbers, turbines can travel across time and space, laying the grounds for a national – indeed international – collection.
New visualisation tools allow for the implementation of detailed information about individual details of data, especially ones that which pinpoint specific places. They let users zoom into a local datapoint and then zoom out to understand how it fits within the global story. Such tools empower and support the creation of detail-rich local histories surrounding the turbines. They can show power stations getting caught up in environmental, financial, and political scandals. They can introduce reminiscences and oral histories of individuals who worked with the turbines. Digitised technical drawings allow engineers to study differences between local designs. This ability to zoom in and out allows us to connect histories and understand the global impact of local stories: to create a national or even global collection of histories.
For me, starting from a list of orders that the company received, creating the map felt like a detective work. We were trying to follow and connect the dots left behind by the turbines within the archival documents. We uncovered unexpected and surprising connections. The map showed us that the impact of the turbines on the coal mining industry was much larger than previously assumed. The presence of Parsons turbines in this industry is no longer being seen as an exception, but rather as one of the many types of electricity-generating engine used at collieries. We were also surprised by the various types of industries that made use of the turbines. Hotels, hospitals, police stations and grocers appear side by side with heavy manufacturers, mills, power stations, and railways. This diversity of industries helps us understand the nature of electricity production before the national grid of the 1920s, when larger companies were still reliant on their own power-production systems. It was a national collection of energy production sites without any centralisation.

Although the early visualisations can already look complete, adding new layers of historical data to them always remains a possibility. We are currently collaborating with Historic England to add images of relevant locations from their Britain from Above aerial photograph collection. We are exploring the integration of historical census data and statistics about electricity generation at power stations. In the future we would like to include historical newspaper articles relevant to the sites where the Parsons turbines or turbo-alternators were used. We are exploring how the public can participate in sharing their memories of working at such sites (and with the turbines). We are hoping to visualise how your story can play a part in a future national collection.