For the communications strand of the Congruence Engine we are still in the exploratory phase. With this in mind I wondered what some of the digital humanities packages purchased by university libraries could offer, not least because an exploration of their capabilities would serve as a measure of what Congruence Engine aims to exceed. What is already available provides a baseline against which we can judge what Congruence Engine will do.
A leading digital history package is Gale Digital Scholar Lab, described as a ‘cloud-based research and learning platform that allows students and researchers to apply natural language processing tools to raw text data (OCR text) from Gale’s primary source collections in a single research platform’. [1] Gale Digital Scholar Lab was launched in 2018, and made available to UCL library users in 2021.
Gale’s Digital Scholar Lab offers access to large and significant digitized collections as well as the tools to build, clean and analyse your own data sets. The primary source collections searchable by Gale include British Literary Manuscripts Online, the Financial Times Historical Archive, other newspapers and magazines such as Scientific American. There are three worked examples, one of which, ‘The Rise of Electricity in the Late 19th and Early 20th Centuries’ is quite close to the interests of the Congruence Engine.
A basic search on ‘communications’ generated 4,007,483 results, which gives a quick sense of the number of the available sources. I ran some other basic searches of likely terms:
| Basic search term | results |
| communications | 4,007,483 |
| telegraph* | 5,163,427 |
| telephon* | 3,315,511 |
| radio* | 1,917,340 |
| internet | 419,219 |
| mobile phone | 139,995 |
I decided to dive further into ‘telephon*’. Results can be filtered, for example by document type, dates, language and source library. Filtering by country (‘England’, ‘Scotland’, ‘Wales’) reduced the hits to 2,774,155. The next step would be to create a ‘content set’, but since the maximum number of results that can be added is 10,000 I had a choice to make: refine further, or start with the 10,000 most relevant? I tried the latter. I had now completed the first of the three steps: ‘Build’ a content set.
The next step was ‘Clean’. Gale Digital Scholar Lab offers a ‘Default Cleaning Configuration’, in which stop words (common words which the analysis tools will ignore), and text correction (for example removing punctuation) can be selected. I went for all default options. Nothing happened. Thinking I was trying too much (too many sources? too many cleaning options?). I decided to reduce the text file radically. I searched for mentions of ‘telephon*’ in publications from Manchester in the month of January 1900. 108 results – much more manageable! I cleaned the data set with reduced options, essentially the pure default mode.
The cleaning phase is hard to figure out. I managed to test clean a sample of 10, but for a good while could not work out how to do the whole set. Nevertheless I proceeded to the analysis stage.
The analysis tools offered by Gale Digital Scholar Lab are: Document Clustering, Ngrams, Sentiment Analysis, Named Entity Recognition, Parts of Speech, and Topic Modelling. It became clear when I ran Ngrams that the data set was still full of uninteresting symbols. More cleaning needed.
At this point it struck me – I should have thought of this before – that ‘telephon*’ would find all the telephone numbers in adverts, which are not immediately interesting.
So, starting again. I decided to look for ‘radio station’, specifically filtered to sources produced in England, Scotland or Wales between 1900 and 1925. This search produced 998 results, a manageable number. Running analyses took between 1 and 10 minutes, depending on the tool.
I again ran into a problem. ‘radio station’ on basic search finds sources with ‘radio’ and ‘station’ somewhere, and not just ‘radio station’. However, ‘“radio station”’ fixes this problem. This search finds 338 sources. If we extend the range to 1940 we get 3,366 hits, a data set ten times the size. I kept both because they would be a useful test of what increasing data set size does to the feasibility of analyses.
Analysis of the “radio station” 1900 to 1940 data set
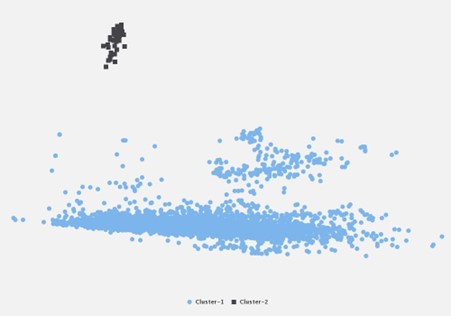
Starting with a Document Clustering analysis (figure 1) there are two clusters: one (in dark grey) a regular table of stocks and international cable transfers that appeared in the Daily Mail Atlantic Edition; the other (in blue) is all the rest of the sources.
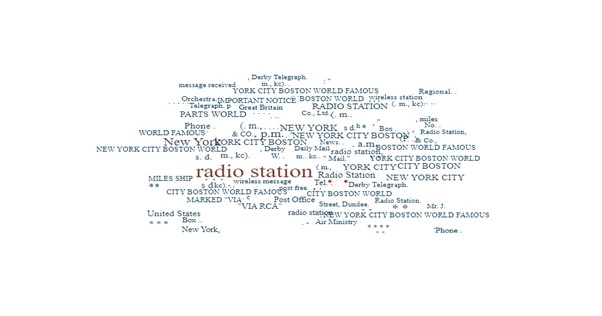
The second tool looks at word frequency, and offers two forms of visualization: ngrams and wordcloud. The wordcloud is in Figure 2. We notice the many names of cities in the United States, an artefact partly of US news being received via radio stations. There are also many punctuation marks, even though these were supposedly stripped out in the cleaning. Beyond these features there are others that might suggest leads into historical analysis. For example, ‘air ministry’ speaks to a connection with defence, while ‘important notice’ hints at communication technologies and the (changing?) urgency of news.
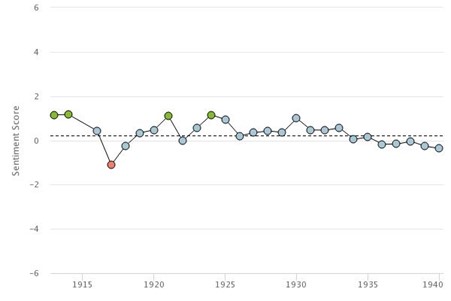
The third tool is Sentiment Analysis, described by Gale as a technique that ‘classifies documents based on an affective (sentiment) orientation of a writer apropos a topic’. It provides an emotional and or moral gauge of the language around the search term within sources. Again there are two ways of visualizing and Figure 3 shows the ‘sentiment over time’ version. Without worrying about statistical significance or independence of variables, we notice that the positive reactions (green) are in the first two decades of radio, trending towards neutrality in the second half. We also notice that the only strongly negative associations around “radio station” are found in the midst of the First World War. Perhaps news reported over radio stations was bad, or perhaps sentiment on many things (including radio stations) was negative. Looking into the 9 documents from 1917 the negative responses were indeed around war (the reappearance of a German cruiser) but also a non-war-related railway accident that killed 11 in Scotland. There is no noticeable negativity around the term “radio station” in either the 1929 economic crash or the outbreak of the Second World War. In general these sentiment analyses cannot simply be assumed to tell us about attitudes to the search term since the tool examines language around the term which might not (and often doesn’t) directly address the term.
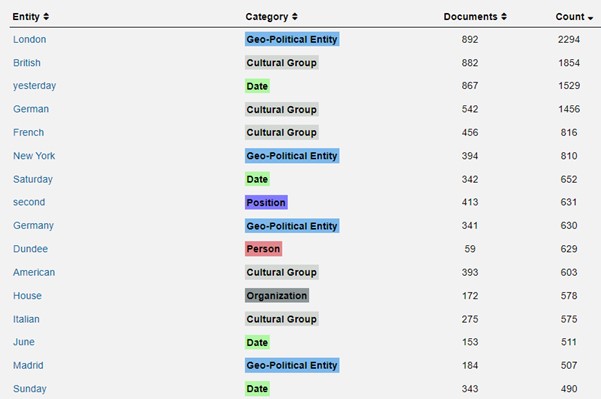
The fourth tool is Named Entity Recognition, which identifies and classifies terms in the data set, and can be applied, says Gale, ‘to identify key people, places, and things within a Content Set. … [It] can be useful when collecting data around place names for mapping, which can often be challenging to aggregate without the close reading of each document’.[2] In practice it works like an ngram with extra classification. The possible categories are: Date, Time, Geography, Geo-Political Entity, Place, Artwork, Event, Law, Product, Person, Measurement, Money, Number, Percentage, Position, Cultural Group, Language and Organization.
Some results – the top sixteen – from the Named Entity Recognition analysis are shown in Figure 4. It is ordered by counts (London comes top with 2294 mentions in 892 documents) and places each entity within a category (London is a Geo-political entity). By reordering the results (which can be outputted as a .csv file readable in Excel), it is quite easy to look at all the entities within each category. So, for example, choosing ‘Geo-political entity’ generates a ranked list of what are mostly cities and towns, such as London (2294 mentions), Glasgow (238), Belfast (84), Penzance (42) or Jerusalem (24). While Gale Digital Scholar Lab does not have the feature, it would be clearly possible to generate heat maps of the appearance of search terms.
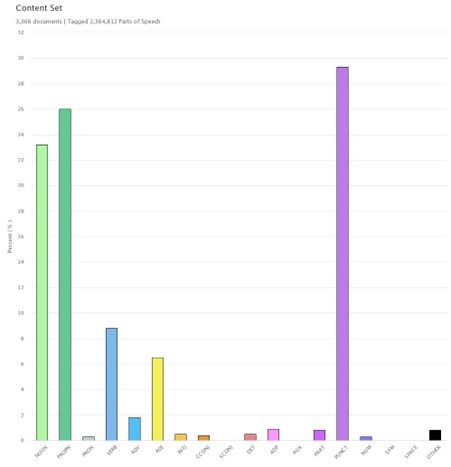
The fifth tool is Parts of Speech, an analysis of grammar and syntax. Not especially informative, the results are shown in Figure 5: plenty of nouns (light green), proper nouns (dark green), verbs (yellow) and punctuation (purple).
The sixth and final tool is Topic Modelling, which discovers groups of words which are statistically more likely to occur near to each other within the data set. These groups might indicate topics. The groups are further measured for values such as coherence, Gale Digital Scholar Lab relies on another software package, MALLET, to perform this analysis.
Running Topic Modelling on the “radio station” 1900 to 1940 data set discovers ten topics (for some reason numbered from zero to 9). In Figure 6 the groupings of words are listed for each topic as well as my speculative guess at what topic each grouping might refer to. Some seem quite likely and stable (such as the ‘war’ topic 4). Topics discovered using this tool might then be targets of historical questions.
| Topic | Words in group | Actual Topic? |
| 0 | message miles station radio received crew steamer ship night said | Shipping |
| 1 | left London New Box June WANTED York E.C arrd Nov | Advertisements |
| 2 | station radio new time wireless tho work London great stations | Radio |
| 3 | Mrs Miss film week story man young John girl | Cinema |
| 4 | Government German British troops station night radio war Madrid yesterday | War |
| 5 | RADIO NEW WORLD YORK New Street RCA HOTEL London SHIP | Advertisements |
| 6 | Street Dundee Apply Sale Ltd price post Road good Phone | Advertisements |
| 7 | year said Council Company service Sir Committee company meeting Government | Politics or commerce |
| 8 | good Hull Write Derby House Mail WANTED SALE rooms Tel | Advertisements |
| 9 | Orchestra News Time Regional music Music Concert National Weather Dance | Music |
Figure 6. Output of Topic Modelling on “radio station” 1900 to 1940 data set. These ten topics were identified using Gale Digital Scholar Lab. In the final column is my suggestion of what each grouping might refer to.
Concluding thoughts
The tools of Gale Digital Scholar Lab provide an enhanced search engine for digitized sources relevant for historical research. It is a usable and largely intuitive interface, once a few confusions had been cleared away (notably how and when cleaning of data occurs and how search terms work).
There are features that are missing but would be valuable if added to a later edition of the platform (for example, geographical mapping). There are also other problems, not least the very poor quality of some of the OCR which is evident once you dig into individual sources, and limitations, such as the maximum of 10,000 sources in a data set. Having said that, the speed of the analyses was manageable, even with an ordinary university desktop PC. The searches are also, of course, limited to the collections accessible to the Gale software, although some of these are very important and rich.
Searching ‘radio station’ produced plenty of hits that related to programming information for radio shows. In some ways this prominence was similar to the issue of searching for ‘telephon*’ and hitting telephone numbers. Indeed it might be a quirk, perhaps even problem, for the communications strand that the search terms we are interested in are means of communicating as well as communication topics. In the Congruence Engine project we may well be mapping radio stations and how they feature in the collections of museums and partners. There should be ways of cross-referencing what we find to mentions of radio stations in newspapers and magazines which can be assembled partly through platforms such as Gale. However there is plenty of interconnecting work we want to do in the communications strand of Congruence Engine that is NOT presently possible just by using the standard digital history platforms such as Gale Digital Scholar Lab. We therefore have much to explore and try out.
Finally I found it quite difficult to not dive down rabbit holes[3], to keep at the ‘distant reading’ level where the unique advantages of digital history can be found and not be tempted into the ‘close reading’ of individual sources that seemed intriguing.
Footnotes
[1] Gale Digital Scholar Lab, FAQs. https://go.gale.com/ps/helpCenter?userGroupName=ucl_ttda&nspage=true&prodId=DSLAB&docId=UCHJJN776013164&sid=bookmark-DSLAB&asid=e074efe5
[2] Gale Digital Scholar Lab. Named Entity Recognition. https://go.gale.com/ps/helpCenter?userGroupName=ucl_ttda&nspage=true&prodId=DSLAB&docId=RFPTLM684241809&sid=bookmark-DSLAB&asid=e7d966c9
[3] There is a particularly intriguing source by the economist Jevons who asks in what ways telegraph is similar or different from transport communications. Good historical question!