The Congruence Engine is aiming to create new collections-based industrial histories. Collection objects offer a compelling starting point for industrial histories; however, the best and most interesting such histories extend outwards, beyond the walls of the museum into the world beyond. This is where digital tools can be used to draw new connections and link museum objects to the broader material realm of past societies.
Historians often talk about context as what we add to situate people, things or events in order to create perspective and understanding. For a curator, context might relate more tightly to the provenance, the materiality or the rarity of an object. Such information has often been sought in contemporary reference works which might allow one to check such details against other sources. For example, if a curator intends to exhibit an example of an early bicycle design from the late nineteenth-century, they might reach for a contemporary catalogue or directory for details of its life-story or its prevalence in the past. For many objects in British collections this has often involved calling up a local trade directory.
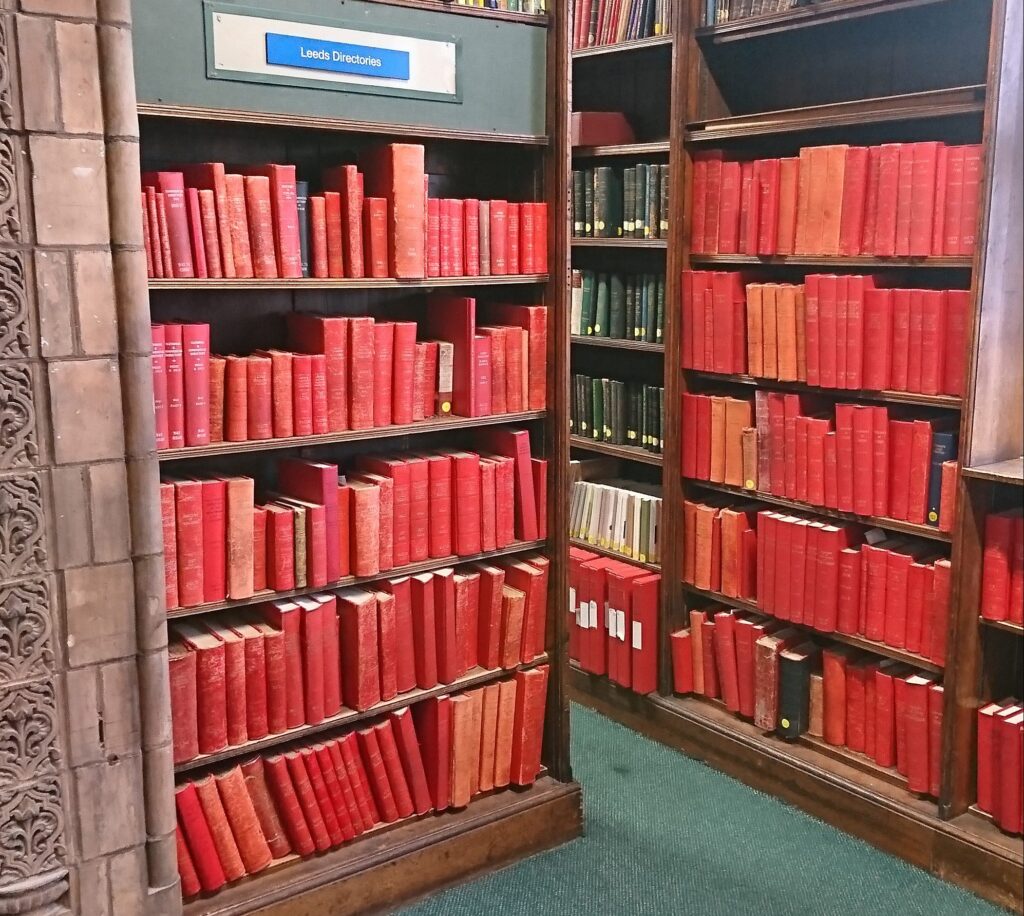
These books – published serially and in huge numbers – were collected by local libraries over many decades (as seen here in Leeds Central Library), long recognised as crucial sources for local historians because of the rich and detailed information they contain about the social and economic activity of the past. This recognition led to the creation of a substantial digitisation project at the University of Leicester in the early 2000s, which made a sub-sample of these directories available online for researchers and the public. As reference works that provide contemporaneous information on objects, people and companies, trade directories are unparalleled. And yet, despite the ‘Leicester Collection’ becoming a definitive source of online trade directories during nearly two decades of its existence, its full potential as a national collection has yet to be realised.
Given an object in the Science Museum collection such as our example of the safety bicycle – a significant milestone in the history of cycling as a technology of mass transportation – triangulating via a trade directory can give us the historical address of its manufacturer.
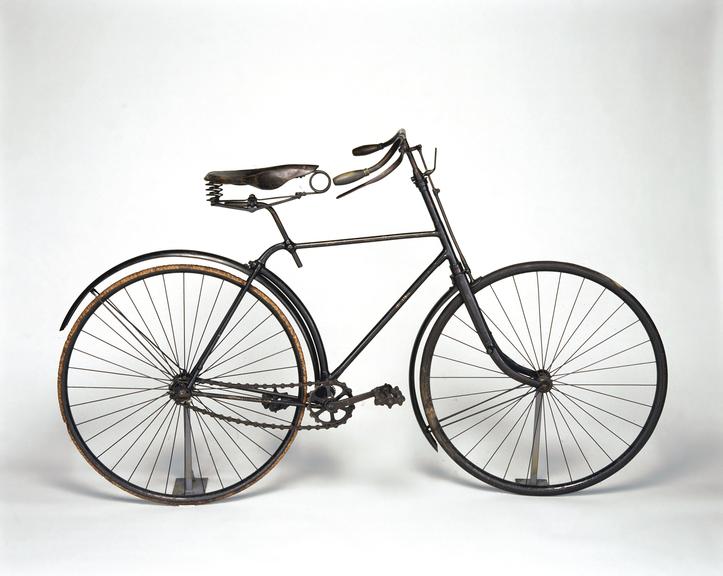
© The Board of Trustees of the Science Museum
From this geographical information we can at present (thanks to the University of Leicester) search within other freely available sources to find and then visually inspect this location without leaving our desk. This ability to add historical texture to our investigations is still a fairly new affordance, and one that will develop further as new sources are digitised and made available. However, all of this remains akin to a manual form of search that has merely been transposed online.
In addition to the many uses of trade directories already made by researchers, what new or radical forms of contextualisation could become possible if their contents became available to use at scale? For instance, rather than reading listings one by one, searching by named entries, what if we could search across a whole town, city, or even a region of the country? Or, instead of searching within the directory for a given year, we could search across a range of multiple years or even decades? Combining search queries across time and space at much larger scale, and filtering by economic sectors or the names of specific entities, companies or individuals, could yield insights into many historiographical questions concerned with change over time in ways not currently possible.
The data which is the output of such searches could eventually be linked and connected to other sources – e.g., demographic, such as the census; or, geographic, such as historical map collections – opening up whole new forms of comparative research which bring these different datasets into connection and conversation with each other. What would these new forms of search, such as those combinations just mentioned look like in practice, and what would be needed to develop them?
If we return to the example mentioned above, we might be curious to understand more about that bicycle in a museum collection. For instance: why were so many bicycles produced in the English West Midlands in the first place? This is a big question in economic history, but we can approach it in a number of ways using trade directories ‘at scale’. To begin with, what was the demographic footprint of the bicycle trade among the general workforce? It would be useful to combine the local detail of the directories with information about occupations from the census. Likewise, we might ask: what was the impact of this geographical patterning on other industries in that city and region? What if we could take business addresses across a whole region and plot them on historical maps to visualise their distribution? To display such information in new ways is not only decorative, but can allow forms of spatial reasoning and suggest new historical hypotheses which are not apparent from reading addresses in a list. Amateur and professional historians alike have approached these questions about specialisation and clustering; yet, a reliably searchable version of a single, local trade directory that would allow one to do this does not exist, still less does it exist for interesting series of years, let alone the entire collection.
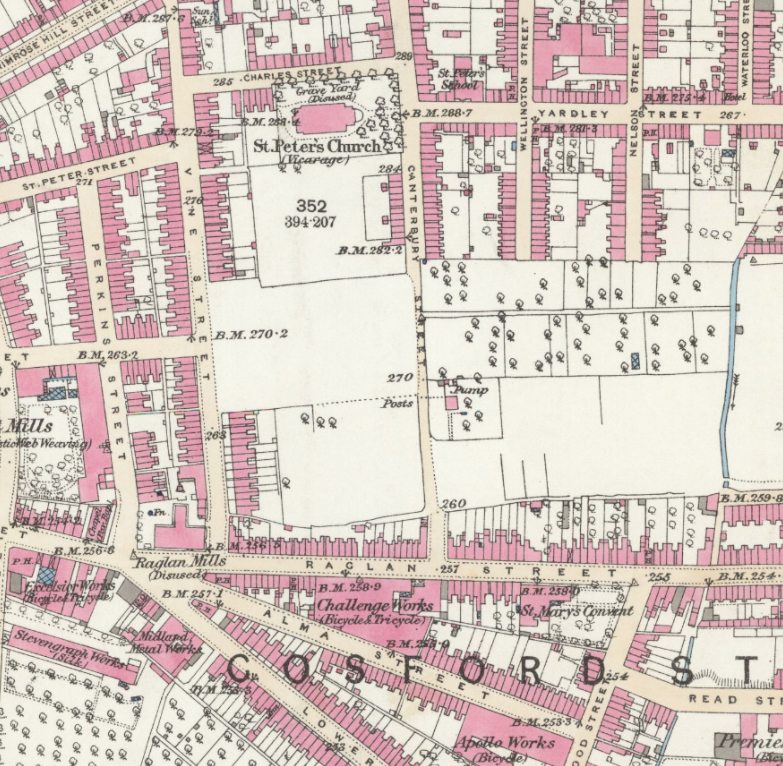
To see why this might be useful, let us imagine a typical workflow using a trade directory: we might seek the address of a manufacturer, in this case, ‘Singer’. Using an 1896 directory for Warwickshire, digitised as part of the Leicester collection, we can (without leaving our desk) manually search the relevant section for a listing until we find ‘Alma Street’. Turning to a 25-inch Ordnance Survey map for Coventry surveyed shortly after (in 1903), we can find the Singer factory taking up an enormous plot of land in that vicinity; however, the address does not quite match the directory.
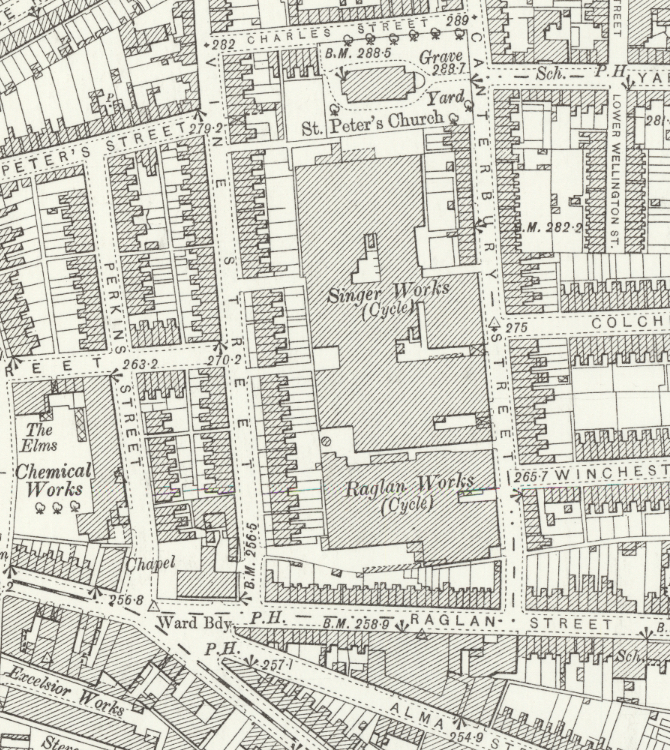
A map surveyed slightly earlier (1887 – earlier than the publication of the directory we are using) resolves the puzzle: we can now see that Singer moved at some point between the publication of the two map editions from a small site on Alma Street (Challenge Works) to his eventual, much bigger site across the road. This discrepancy highlights the importance of attending to the chronology of reference works, only made possible by detailed metadata, and the need to shift scales in our analysis when called for.
This rather detailed finding conforms to what we know already: that during this period, known as the bike boom, there was rapid expansion of manufacturing in Coventry as companies grew and developed, foremost among them, Singer.
But in order to relate these traces of evidence to the broader background – to say something about the economic context – it would be useful to know more about the place bicycle manufacture occupied within Coventry. We know it was important, but how many firms were there in total? It would be very useful to have a list, and even better to show how this list expanded over time, with yearly entries. Indeed, it would be extremely interesting to know how many new manufacturers there were in each year during that decade. It would be even better to know how many manufacturing firms of any sort existed in Coventry, and so to estimate what proportion were bicycle manufacturers. What if we could create a further category of analysis to show how many firms were indirectly involved in the bicycle manufacture supply chain, such as wheel rims, leather or bearings? What proportion of firms might then we ask did not have some connection to the bicycle trade? And how did this pattern change year-on-year? Information to help address these questions can be found listed in just one of the sections of the trade directories, if only it could be extracted into a structured form.
This example of a relatively small industry illustrates the potential of a machine-readable version of just one section of one series of trade directories. It shows how such a dataset would allow us to shift the scale of a historical query in a way that provides much expanded quantitative forms of context. If such a dataset could be produced with annual coverage, it would provide an open-ended resource both for existing research questions, and also new historical questions that cannot yet be anticipated. But to produce information at this high resolution of detail, across a broad swathe of time and space, requires painstaking effort of transcription which may not be justified by any one single research question or project (although, clearly, such work has been done in the past for writing various histories).
The existing form of the digitised directories contains text output from optical character recognition (OCR) produced when the images were originally scanned. But even where this text is of good quality (where OCR has worked well) the challenge of making this material machine readable, relates to the layout on the page. Like other reference works, directories were printed in columns using complex layout involving headings and sub-sections which are not consistent. Existing OCR engines are not equipped to understand where column breaks occur and produce plain text output filled with errors where lines run across multiple columns and the internal hierarchy of the document has not been preserved. This ‘semantic’ content of the document which derives from its layout – so intuitive to the human eye – has almost entirely been lost in the conversion to digital form, and so sub-sections no longer attach to their correct positions of meaning on the page, making it unreadable by a computer.
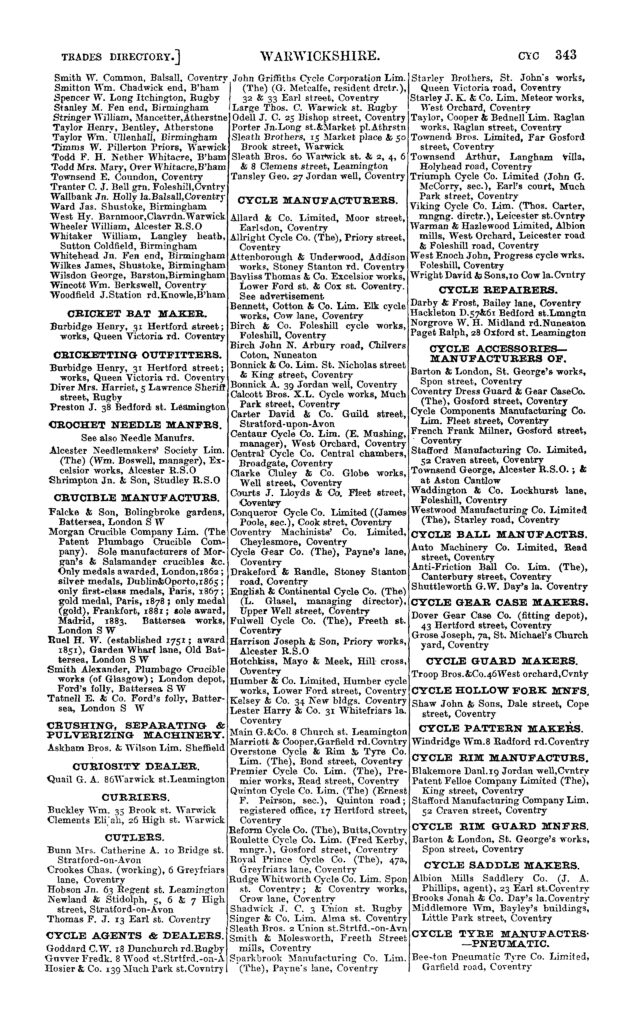
This page from a relevant directory volume – Kelly’s Directory of Warwickshire from 1896 – shows the ‘Trade Listings’ section, which contains the information we are interested in, laid out neatly for the human reader.
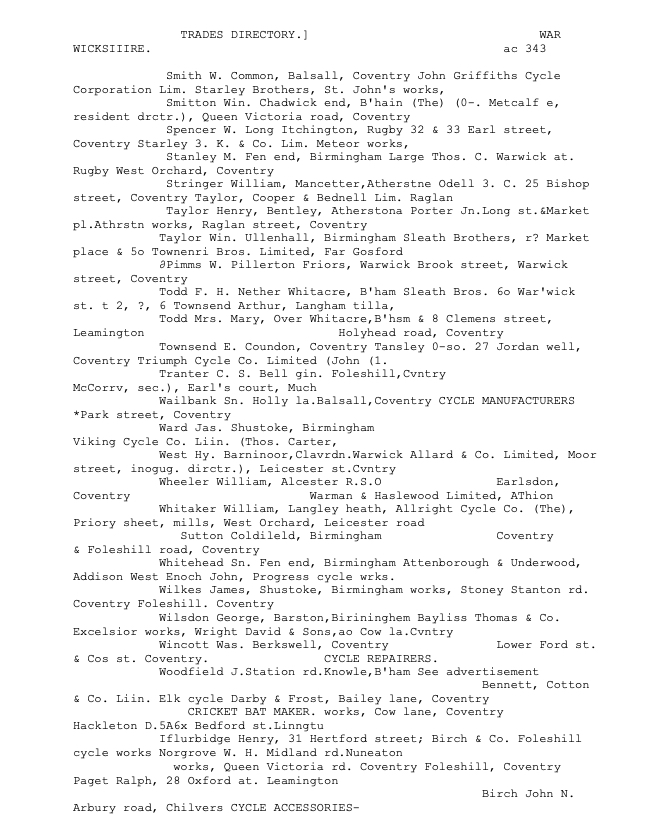
However, after being scanned and passed through an existing OCR engine, the plaintext produced looks like something like this (below), in which the layout structure has been entirely lost. The simple question of how many cycle manufacturers are listed under that heading, has become impossible to answer:
The technical challenge therefore is to overcome this loss by capturing the original meaning of this document conveyed by its layout and preserving it in digital form. This is a challenge addressed today in the field of computer vision (CV), which is concerned in general terms with making visual information machine readable for various forms of analysis. The dramatic rise of CV in recent years has been built on advances in machine learning (ML) thanks to newly available software libraries and neural networks, large datasets and, crucially, the use of Graphics Processing Units (GPUs) to undertake the heavy computation needed to train models quickly. CV models have allowed major technical breakthroughs in image segmentation as well as classification and object detection – tasks which are trivial for a human, but very difficult to generalise and deploy at scale across different types of document. The challenge of document layout analysis is therefore at the cutting-edge of ML and CV research; however there is a further challenge relating to the problem that the image datasets on which CV models are commonly trained e.g., those scraped from the internet, are not necessarily well-suited for working with historical documents, such as the trade directories in the Leicester collection, where the main issue relates to the design and layout of text on the page.
With all of this in mind, we wanted to ask what it would take to build a method for automatically processing and structuring the kind of information contained in historical documents such as our trade directories, so that they could be used by researchers at scale. A handful of software engineers and researchers in different countries have approached these issues but, as yet, there are no such general pipelines in existence for these kinds of ‘hard to wrangle’ historical documents. Although we are primarily motivated by working with trade directories to address questions such as those mentioned above, the potential value of a general tool or pipeline would be incalculable for unlocking historical reference works for digital research, and therefore of interest to many scholars beyond those in this project.
To explore some possible approaches to this challenge, we invited colleagues from The Alan Turing Institute – historians, data scientists and curators with interests in document layout analysis, CV and OCR – to come together in hands-on workshop to survey the state of the art and to plan a way forward. In the next post, which will appear on the blog of the ‘Living with Machines’ project – with whom we have collaborated on this issue – I will outline and reflect on our initial findings and progress so far…